As the virus drags on, economies start to look bleak. Investors who rode the markets down to the depths of March and back out again, start to think…
‘None of this makes sense, surely the market is going down again.’
The news lately hasn’t been positive. Wave two condemns Victorians to house arrest, and a seemingly never-ending wave continues to plague the US. So how do some stockmarkets keep moving up? Or at the minimum, keep levitating above where you think common sense dictates they should be?
Government and Central Bank stimulus explains some of it. More importantly, the phrase ‘the stockmarket is not the economy’ has been used quite a lot lately. And it is apt. Investors often look around for economic signs to inform their investment decisions, but that’s not common sense. It’s heuristics. Taking a mental short cut to arrive at a conclusion that’s easy and seems to make sense.
A pandemic is undeniably bad. Yet it doesn’t completely run across the economy and wreck everything in its path. The damage it does in one space sends money and economic activity elsewhere. The economy is being reorganised at record pace. Especially today. In contrast to 50 years ago, things are different in the respect that a large number of workers don’t need to leave their homes to work. Even more significantly, the average consumer doesn’t need to leave their home to spend.
The stockmarket isn’t the economy in another sense. A restaurant, coffee shop, or clothing store shuttered in Melbourne likely aren’t listed on the stock exchange. Dominos is. Woolworths is. Coles is. They’ll bring food to your house. In Tasmania, where lockdown ended months ago, the number of Dominos delivery people zooming around seems to have exploded.
The economic devastation in contrast to the stockmarket racing higher may seem perverse, but it’s not necessarily wrong. Some companies and sectors aren’t even affected. They have global operations and revenue pouring in from various jurisdictions where things are looking better. Others have a smaller weighting in the stockmarket so their poor performance may not be of much consequence. A good way to understand what is happening in Australia is to look directly at the various market sectors.
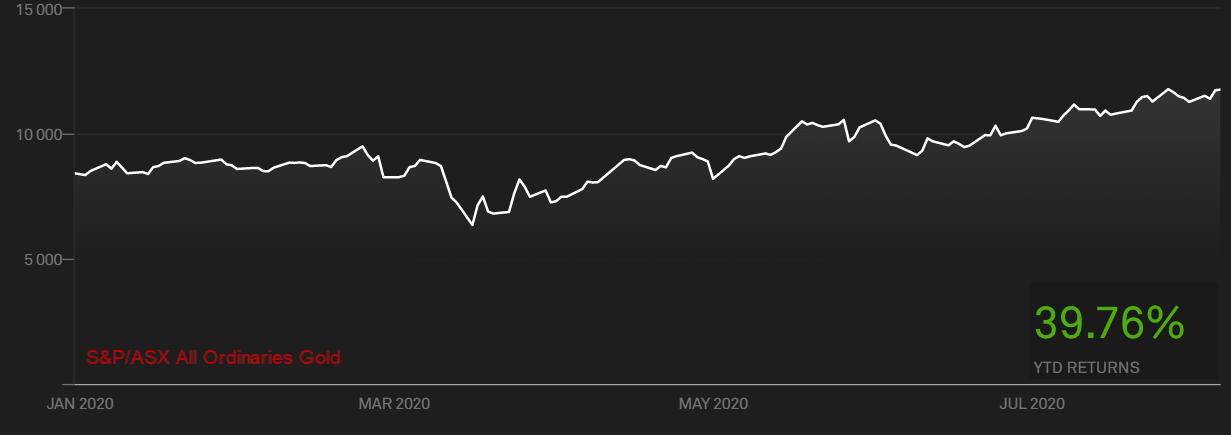
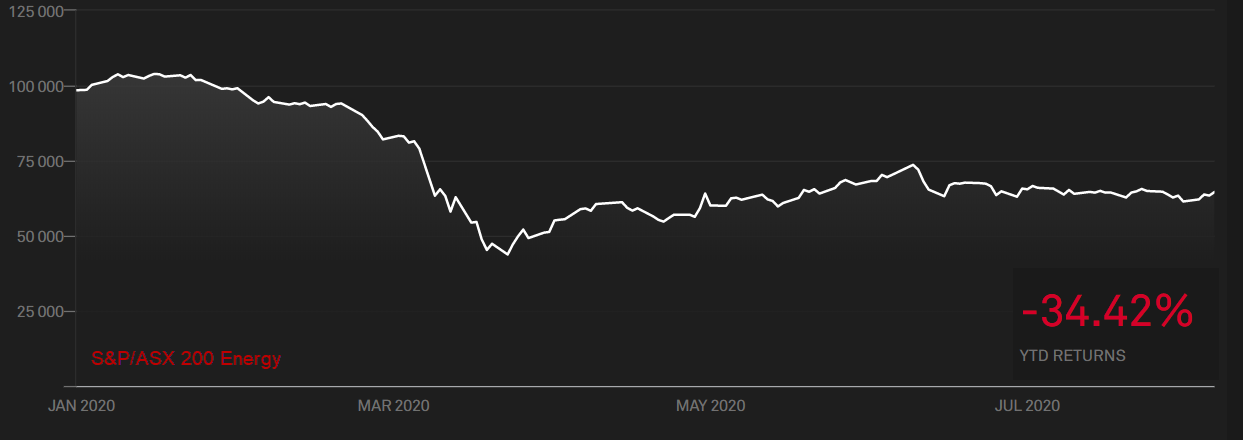
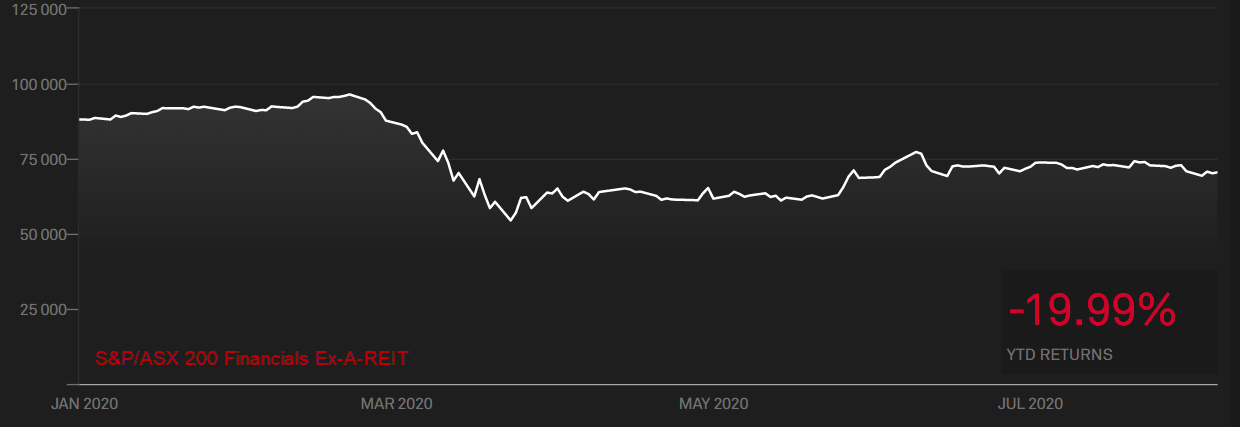
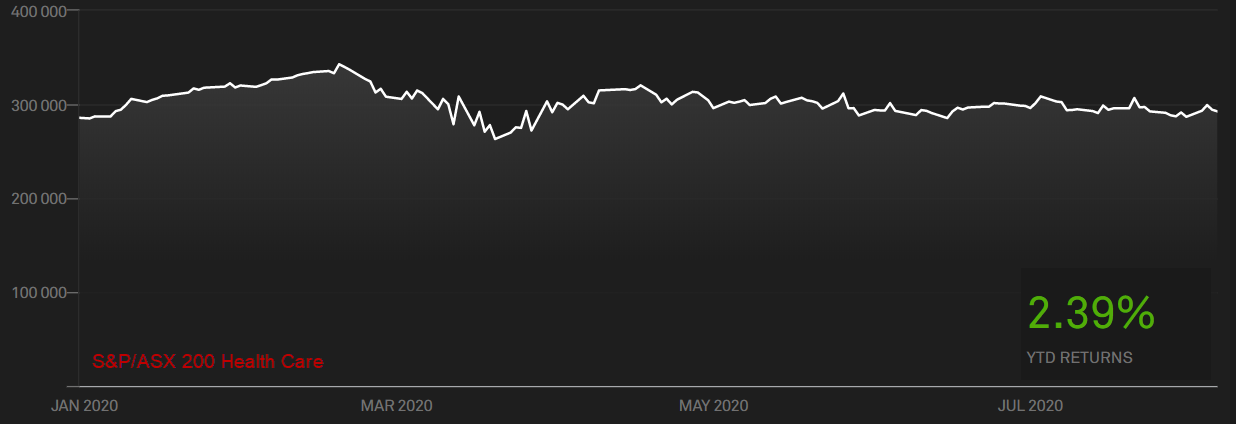
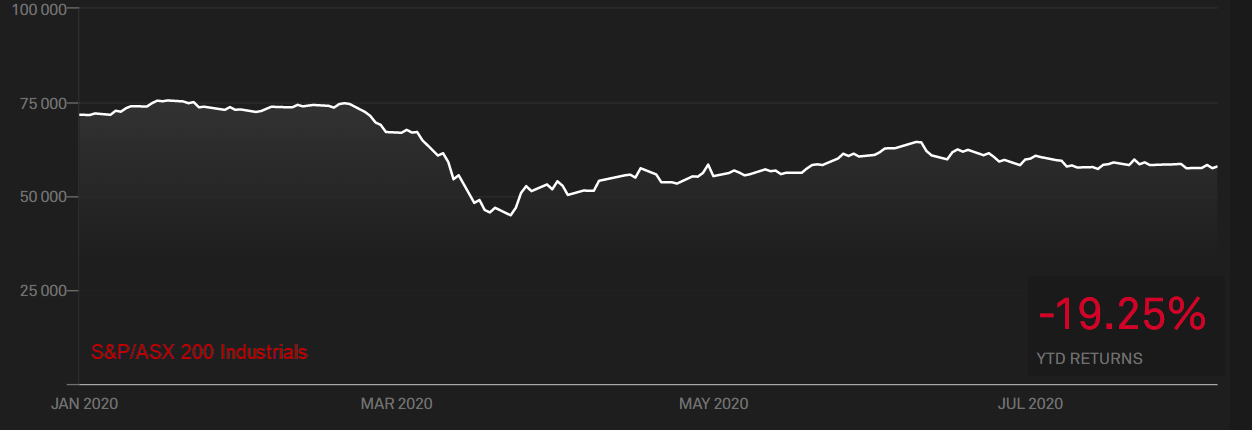
Here are some charts of the various sectors on the ASX. Some overlap in some sense, but it gives a good overview of where things are. The following charts are compiled on a total return basis year to August 6. First up gold, the current flavour of the month. If you wonder why you don’t hold gold in your portfolio, in some sense you do. Gold miners are currently doing well, anyone with diversified exposure to the ASX or global markets inevitably has exposure to gold through gold miners.
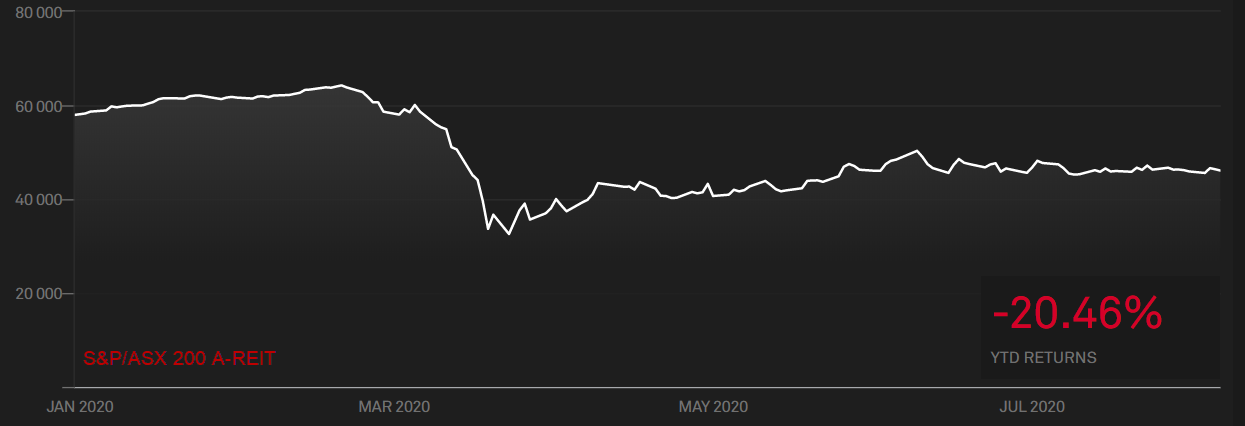
A-REITs or listed real estate. Like all sectors, it was hit hard initially. Any recovery has been meek, and the outlook is poor. Shopping centres are seeing less traffic and clouds hover over office buildings due to work from home potential. The sector is currently priced without much expectation.
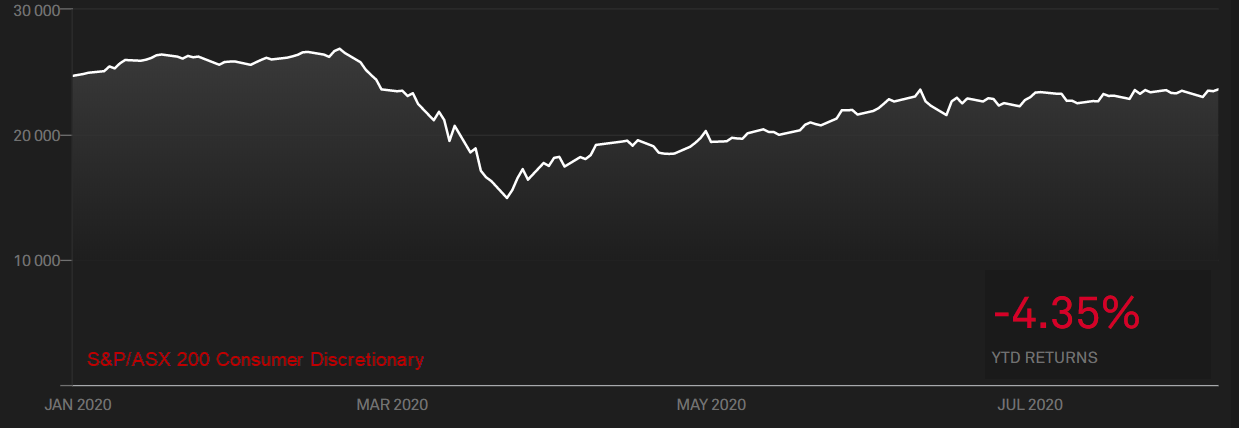
Consumer discretionary. A diverse bunch. Fast food, gambling, clothing, electronics, hotels, furniture, travel companies. You may have expected this area to see more pain, but stimulus money is sloshing around the economy. While some people aren’t eating out, as an example, Dominos delivery people seem to be everywhere. Meal kit delivery company Marley Spoon has seen huge growth.
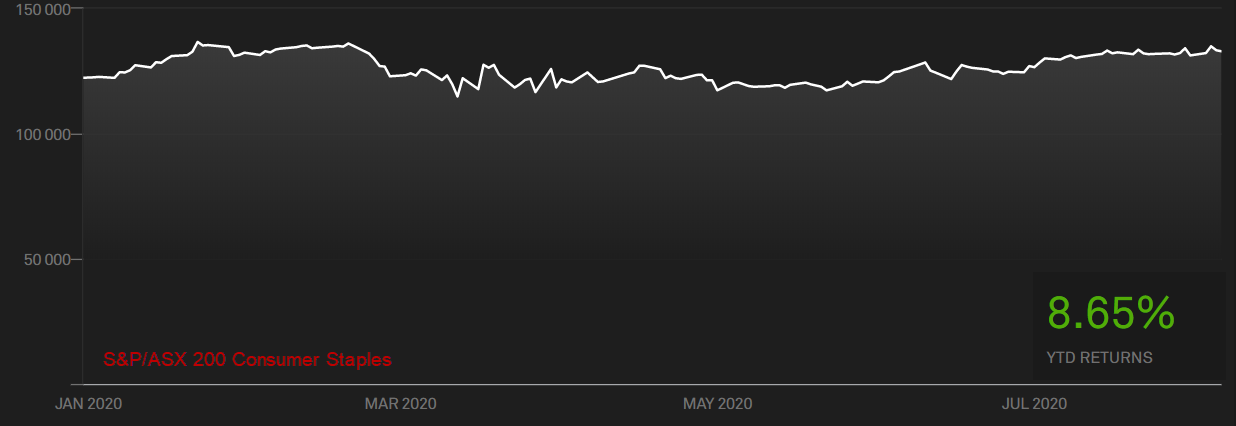
Consumer staples. A sector of strength, but surprisingly being dragged by Woolworths due to COVID costs and a new enterprise agreement. In comparison, Coles is doing much better. Stimulus means the rest of the sector has performed solidly.
Energy, the big stinker of the year. No surprise, with major producing countries deciding to kick off a price war just as worldwide demand fell away. As they say, the cure for low oil prices are low oil prices. Whenever the oil price recovers it will be reflected here.
Financials excluding A-REIT (listed real estate) sector. With the banks dominating, the performance here is to be expected. This also reflects the negative outlook for the sector with many mortgages on pause. One thing we can be sure of, the banks will be afforded every piece of support the government can muster.
Health Care could be called the CSL sector given its dominant weighting. CSL is almost flat for the year, other large companies in the sector like Ansell are benefiting from the demand for protective equipment.
Industrials are heavily dominated by infrastructure. People aren’t on the road paying tolls or transiting through airports, which reflects the lack of recovery here.
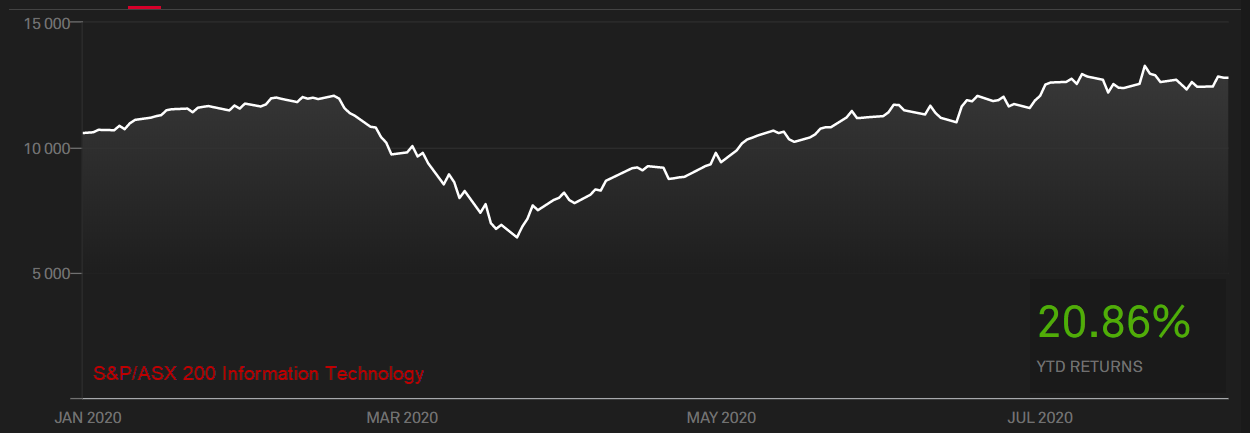
Information Technology. In contrast, when people are instead sitting at home utilising commercial software solutions or data centres to do their work, or splitting their payments for purchases, the information technology sector sees the benefit.
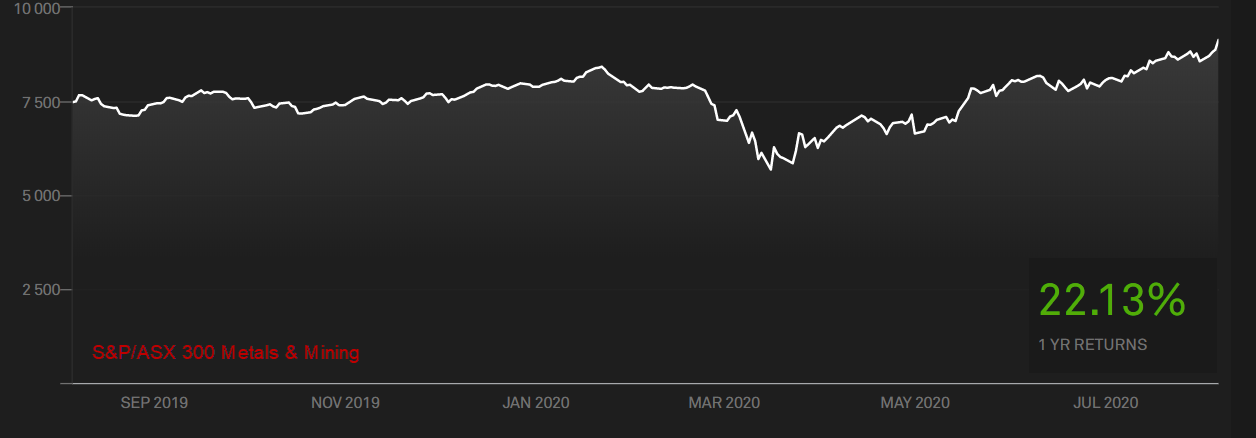
Metals and Mining. Couldn’t be more removed from COVID. Despite the virus, the demand for various resources has not slowed. Prices remain strong, including for iron ore. The biggest beneficiaries are our listed miners. Fortescue is up over 70% for the year.
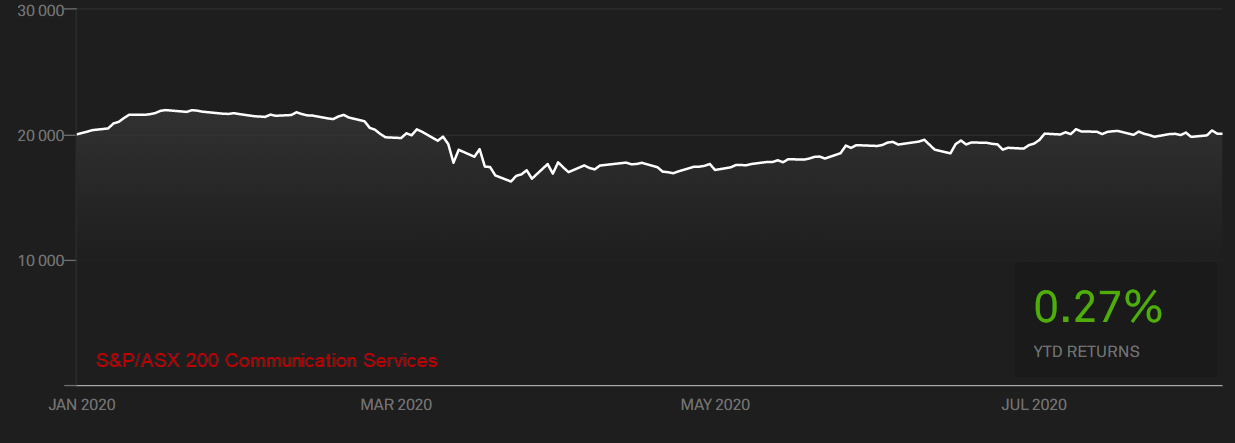
Communications Services. The big gorilla here is Telstra, its performance isn’t great as it sees more and more competition and is less the dominant entity it once was.
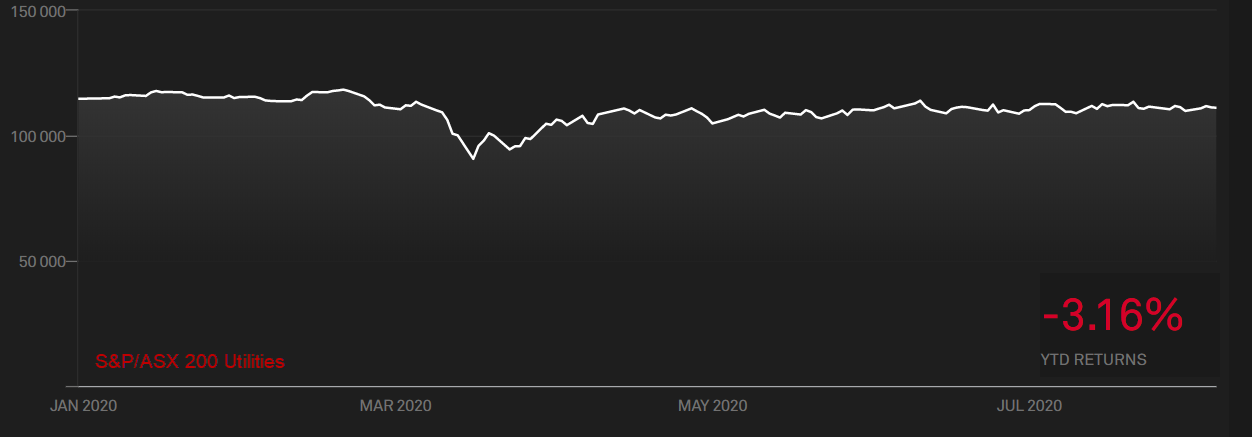
Finally, Utilities. Many were smacked hard during the March sell-off but have recovered. Electricity, gas, etc. Mapping of electricity demand has shown while business demand has fallen, as expected residential demand has increased. In Victoria, this has shown a 2% decline in usage overall.
Each sector has performed very differently so far this year for varying reasons. This is no different from any other year. There will always be winners and losers. Also, these sectors aren’t full of singularly Australian focused companies. Some parts of the world will recover faster than others. We believe the price reflects all known information and for the Australian market, a lot of pain has been priced in. When more news emerges, the market will price that in.
How all these sectors perform together then affect the wider market. Some more so than others due to their weight. Speaking of weight, the US is an interesting case.
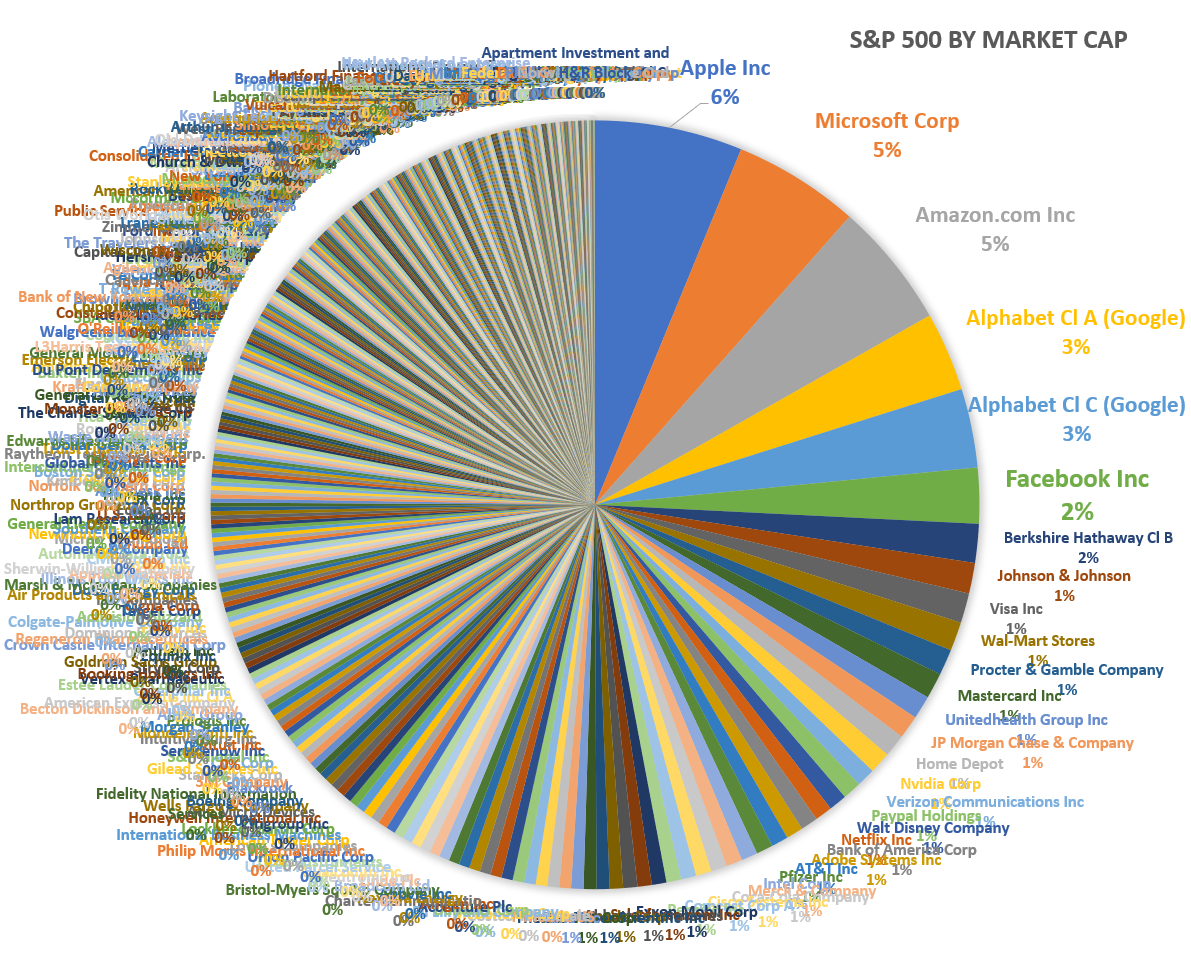
This ugly looking chart shows all the companies in the US S&P 500. We know the US market has been on a tear, but note the biggest companies are all technology or software companies. Apple, Microsoft, Amazon Alphabet (Google), and Facebook. They are driving the market and with good reason, they aren’t affected by the pandemic.
We hear the bad news that a well-known retailer has gone bankrupt, maybe Royal Caribbean or Carnival Cruises stock price is down 75% for the year, but on the stock market this doesn’t matter. The big weightings are what drives the market. There’s a lot of talk about central banks printing money, but you might say the largest companies on the S&P 500 do it too. People are still buying Apple products. People are utilising Microsoft’s products at home. People are ordering products through Amazon. People are seeing ads online thanks to Google and Facebook.
It’s worth remembering larger companies pulling markets along isn’t an anomaly. Maybe not quite to this extent, but sooner or later other companies and sectors will recover. Demand will swell. Those that survive and recover will eventually pull back some ground.
Looking at sectors and market weightings is always a fun exercise. For some of us, the winning sectors or largest slices of the pie have us wondering why we weren’t more exposed to that sector or stock. No one knows what’s going to happen next. Those of us pontificating on where money will flow and who the winners and losers will be may well end up with egg on our faces.
Over ten years ago, Exxon was the largest company on the S&P 500. Today it’s not even in the top 30. Back then energy companies made up 16.8% of the S&P 500, today it’s just 2.6%. Market indices are efficient allocators.
This is the present. It’s not a commentary on the future. Markets aren’t immune from further falls. We’re merely highlighting there is some rationality in where they are currently placed. The price is currently right.
The best way to navigate any of this? A portfolio constructed with your goals in mind, accounting for your short-term spending needs while remaining globally diversified. It will always be the best way to capture gains and protect against downside risks.
This represents general information only. Before making any financial or investment decisions, we recommend you consult a financial planner to take into account your personal investment objectives, financial situation, and individual needs. #investing #goals-based advice #investments #retirement #retirement planning #smsf #wealth creation #personal insurance #superannuation #martincossettini #fiduciary financial advisor #bluediamondfinancial


